
IMAGINE TUNING INTO the World Series on Rogers Sportsnet and a little bar popped up on the bottom of your TV screen that said “buffering…” or that you saw some stalled pixelated nonsense on your big HDTV set, instead of the first pitch.
Most of us, used to decades of easy viewing, of turning on the TV and the video is stable, reliable and clear, would lose it. Our expectations, when we want to be entertained with a TV show, are high. We can’t stand technical interruptions and those high expectations are carried with us as we try to watch our favourite programs anywhere, anytime on any device.
But fixed-line, wired, IP networks are different than traditional cable, satellite or over-the-air broadcast. None of those more mature technologies will break down if too many people are watching the way IP networks choke if too many folks are using their broadband connection to stream movies. And since most North Americans want to watch TV or a movie in the evenings, or prime time, ISPs’ broadband networks are under major stress that time of day as we increasing turn to sources other than cable TV and its brethren for our entertainment.
So, predicts a report by Waterloo’s Sandvine, we may be on the edge of a change in how networks are engineered where the focus is on providing a strong video experience, rather than just gobs of additional bandwidth. (Of course, it is obviously worth disclosing that Sandvine sells traffic management software that helps that sort of engineering. Despite that, the company’s report offers real insight on what is going on within ISP networks around the world.)
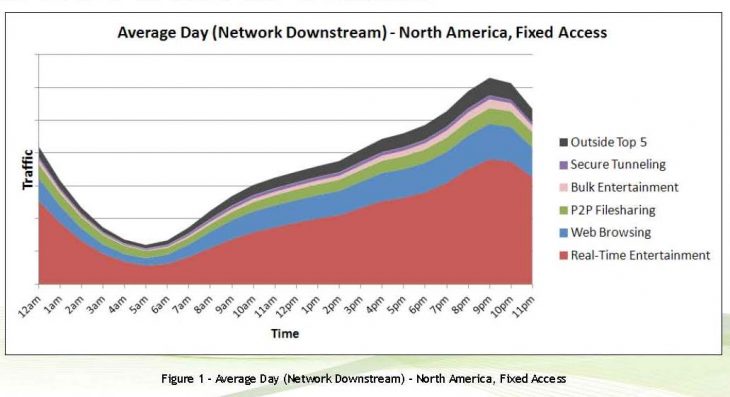
“Within North American fixed networks, Real-Time Entertainment applications are the primary drivers of network capacity requirements, accounting for 60% of peak downstream traffic, up from 50% in 2010. Furthermore, subscriber usage is becoming increasingly concentrated in a smaller band of the evening, driving up network costs despite relatively constant per-subscriber monthly data consumption,” reads the report (those RTE applications include the likes of Netflix and YouTube).
What might be a little shocking is that 55% of that RTE is being viewed on a television, either a smart TV or a regular monitor tied into a smart set top like a Boxee or a game console.
“If this levelling-off of monthly consumption continues, then network operators might be on the cusp of a dramatic shift in how networks are engineered. In a world in which per-subscriber usage is relatively flat from month-to-month, investing to deliver increasing bandwidth no longer makes sense; rather, networks might soon be engineered to deliver a constant quality of experience. To do so effectively, communications service providers will need to look beyond bytes and into metrics that matter, like video quality of experience.”

Measured by daily downstream volume, the top four traffic generators on the web this fall are Netflix (27.6%), general web surfing which includes lots of video (17.8%), YouTube (10%) and BitTorrent (9%) – and most of this is destined not for a PC, but many other devices. “Game consoles, set-top boxes (like Roku or Boxee), smart TVs, tablets, and mobile devices being used within the home combine to receive 55% of all Real-Time Entertainment traffic,” reads the report.
“The fact that more video traffic is going to game consoles than PCs should be a wake-up call that counting bytes is no longer sufficient for network planning, as consumer electronics can drive rapid adoption of new services, in some cases literally overnight (consider the upcoming U.S. Thanksgiving holiday shopping season).”
In North America, aggregate network traffic was within 5% of its peak value for a duration of 2.5 hours just six months ago. However, September 2011 saw a peak duration of only two hours while at the same time, per-subscriber usage remained generally flat overall (mean monthly usage dropped to 22.7 GB from 23.0 GB six months ago) and declined on the lower end (median monthly usage dropped to 5.8 GB from 7.0 GB), “suggesting that subscribers are concentrating the same amount of activity within an increasingly narrow slice of time,” reads the report.
“This shift in behaviour is a worrying trend for providers, who must engineer their networks for peak bandwidth. If we assume that a subscriber’s perception of value is directly tied to his or her monthly usage, then this trend means that it now costs more for service providers to deliver a constant value to the end consumer, and the network itself is increasingly inefficient.”
This trend also means that encouraging customers to shift some of their online usage to “off-peak” hours may well be pointless because who wants to watch a movie at 4 a.m.?
“Monthly usage quotas have only a limited impact, if any at all, on peak network demand; however, quotas that differentiate between peak and off-peak might have a larger impact. If users had 200 GB per month to use at peak, but unlimited usage at other times, then they would be more inclined to change their behaviours. As an added benefit, the user would perceive a higher value of service (again, if ‘value’ is directly associated with data consumption) due to increased overall usage, without the network operator incurring additional cost to deliver the off-peak bytes. Higher subscriber value and flat operator costs? Sounds like a classic win-win,” reads the report.

TRAFFIC ON MOBILE NETWORKS is a bit different, though. The prime time here is 7-9 p.m. and RTE generates 30.8% of peak demand and while YouTube vids make up the bulk of that (18.2%). Web browsing comes second at 27.3% and social networking is third at 20% (and Facebook alone accounts for nearly all of that portion).
Not a lot of HD movie-watching happens on North American mobile networks.
“Facebook accounts for more than 30% of upstream traffic on North America’s mobile networks, typically through frequent photo uploads. HTTP, largely associated with mobile apps, accounts for 26.2% of traffic, and SSL (used for secure applications like online banking) makes up slightly more than 6%. YouTube generates 6%, followed by BitTorrent, with 3.83%,” reads the report.
The company’s report is based on September 2011 Internet traffic statistics voluntarily submitted by a representative cross-section of Sandvine’s customer base. These customers include communications service providers in more than 85 countries, who collectively serve hundreds of millions of end subscribers.
– Greg O’Brien