
PALO ALTO, California — As so much of Canada has adopted work-from-home policies in recent weeks due to Covid-19, the number of people active online at home during the workday has more than doubled in most major cities across the country, according to new data from Wi-Fi services platform provider Plume.
Based in Palo Alto, Calif., Plume provides a cloud-based Wi-Fi services platform for smart homes and works with Internet service providers to deliver whole-home Wi-Fi connectivity. For example, Bell’s Whole Home Wi-Fi service is powered by Plume, according to 2018 blog post on Plume’s website.
Using anonymized data collected from the Plume cloud, which manages more than 700 million devices worldwide, Plume has analyzed the impact of the Covid-19 pandemic on home Wi-Fi usage in the United States, Canada and Europe.
For Canada, Plume’s estimates are based on metropolitan area populations and the anonymized data taken from a sample of Canadian households powered by the Plume cloud. Plume analyzed weekly data from seven metropolitan areas from January 29 to March 26 for its most recent Work From Home Dashboard.
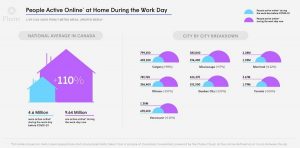
Its Canada-specific data reveals that before the Covid-19 pandemic caused employees to start working from home, and school closures kept kids at home as well, 4.6 million Canadians on average were active online during the workday. That number is now up to 9.64 million, according to Plume’s estimates. Plume defines “active online” as six or more hours of online activity between 9 a.m. and 6 p.m.
Looking at the city-by-city breakdown of the Canadian data, the increase in online activity during the workday ranges from a 97% increase in Mississauga to a 122% jump in Montreal.
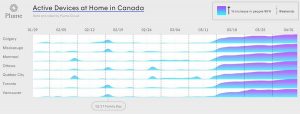
In a second graph showing active devices at home in Canada, with data collected up until the end of last week, there is a clear surge in device usage during weekdays starting around March 16 that has been sustained over the last three weeks. Unfortunately, the graph doesn’t provide actual numbers to support the visual representation of the increase in weekday device usage at home.
Plume’s U.S. data dashboard includes a chart showing the number of active use hours broken down by device type (computers, smartphones and entertainment devices, such as streaming set-top boxes, smart TVs and gaming consoles) during different times of the week and weekend. In the case of the U.S., weekday device usage at home started to ramp up during the week of March 9, according to Plume’s chart.
For more information about Plume, please click here.