
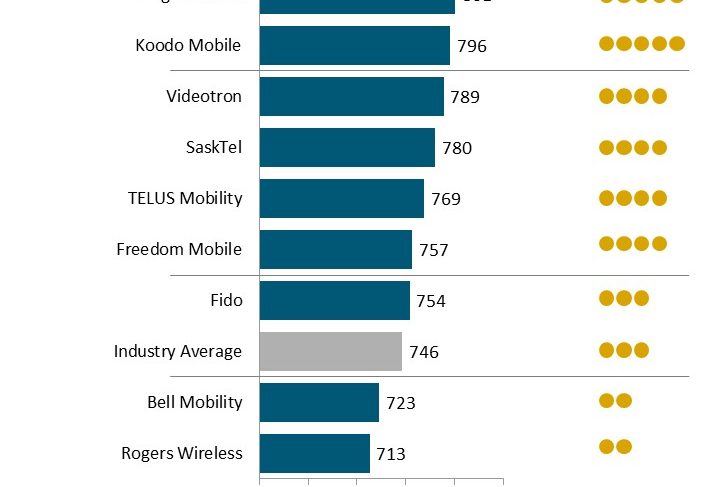
TORONTO – Bell’s Virgin Mobile ranks highest in wireless customer satisfaction, followed closely by Telus’ Koodo Mobile and Videotron, says an annual study by J.D. Power & Associates released Thursday.
According to the J.D. Power 2017 Canadian Wireless Customer Care Study, customers who are delighted with their wireless carrier experience cite high rates of behaviours that demonstrate courtesy, concern and knowledge. Delighted customers also have much higher levels of loyalty and advocacy.
The study measured wireless customers’ perceptions of their carrier’s performance and is based on an online survey of more than 5,500 wireless customers in September-October 2016 and March 2017. Satisfaction is measured across four factors (listed in order of importance): phone customer service representative (CSR); in-store service; online service; and phone automated response system (ARS). Delighted customers are those with overall satisfaction scores of 900 or higher (on a 1,000-point scale). In 2017, overall wireless customer care satisfaction rises to 746 from 738 in 2016.
Regardless of whether the service contact occurs by phone, in the store or online, delighted customers experience representative behaviours pertaining to courtesy, concern or knowledge at higher rates than pleased customers. For example, among customers who speak with a phone service representative, 95% of delighted customers are offered assistance with other issues vs. only 89% of pleased customers (those with an overall satisfaction score of 750-899) who are offered this assistance. Similarly, among customers who visit a store for service, 72% of delighted customers are greeted vs. only 64% of pleased customers who are greeted. Among those who use online chat, 98% of delighted customers are thanked, compared with only 90% of pleased customers who are thanked.
Moreover, delighted customers are transferred between service representatives less frequently than pleased customers; spend a shorter amount of time trying to resolve their issues; and have a higher percentage of their issues resolved. For example, among delighted customers who speak with a phone service representative, only 19% are transferred (vs. 31% of pleased customers); the average time spent trying to resolve an issue is 7.6 minutes (vs. 10.3 minutes); and 86% of issues are resolved on the first contact (vs. 76%).
Nearly half (47%) of customers who are delighted with their care experience say they “definitely will not” switch carriers in the next 12 months, compared with 29% of pleased customers who say the same thing. Additionally, 70% of delighted customers say they “definitely will” recommend their carrier, compared with 43% of pleased customers who say the same thing. While delighted customers have made an average of 4.3 positive recommendations about their carrier during the previous 12 months, pleased customers have made only 2.6 positive recommendations.
“Representatives who are empowered to resolve issues on their own, are consistently courteous, and who show that they value the customer’s time are key for increasing the number of customers who feel their care experience was exceptional,” said Peter Cunningham, J.D. Power’s senior director and technology, media & telecom practice leader, in the report’s news release. “Moving customers into the delighted category can reduce churn, since these customers demonstrate very high levels of loyalty and advocacy.”
Other key findings include:
– In-store service factor improves most: While all factor scores improve from 2016, the in-store service factor has improved by 18 points;
– Customer service a major consideration: Two-fifths (40%) of customers cite “good customer service” as a reason they selected their carrier. “Good customer service” ties with “price” as the second most commonly cited reason, after “offered good service plan options” (41%);
– Time matters: Overall satisfaction is 837 when it takes less than 5 minutes to resolve a problem online, compared with 693 when it takes 10 minutes or more to reach a resolution – a 144-point difference. Satisfaction is also affected when more web pages must be viewed to resolve an issue (765 for three or fewer pages vs. 676 for four or more pages).